Cursor is changing how developers interact with AI agents, moving beyond static text outputs to dynamic, interactive visualizations called canvases.
These new React-based UI elements, available in Cursor 3.1, allow AI agents to generate dashboards and custom interfaces that integrate real-world data, making complex information more digestible and actionable for tasks like code reviews and incident response.
The update aims to significantly enhance human-AI collaboration by providing richer, non-linear ways to present and explore data, accelerating development workflows.
AI agents are no longer confined to generating blocks of text; they can now render interactive visual components directly within the Cursor environment. This means developers can explore data visually rather than sifting through lengthy chat logs or markdown files. Canvases function as durable artifacts within the Agents Window, appearing alongside existing tools like the terminal and source control.
Enhancing Developer Workflows with Visualizations
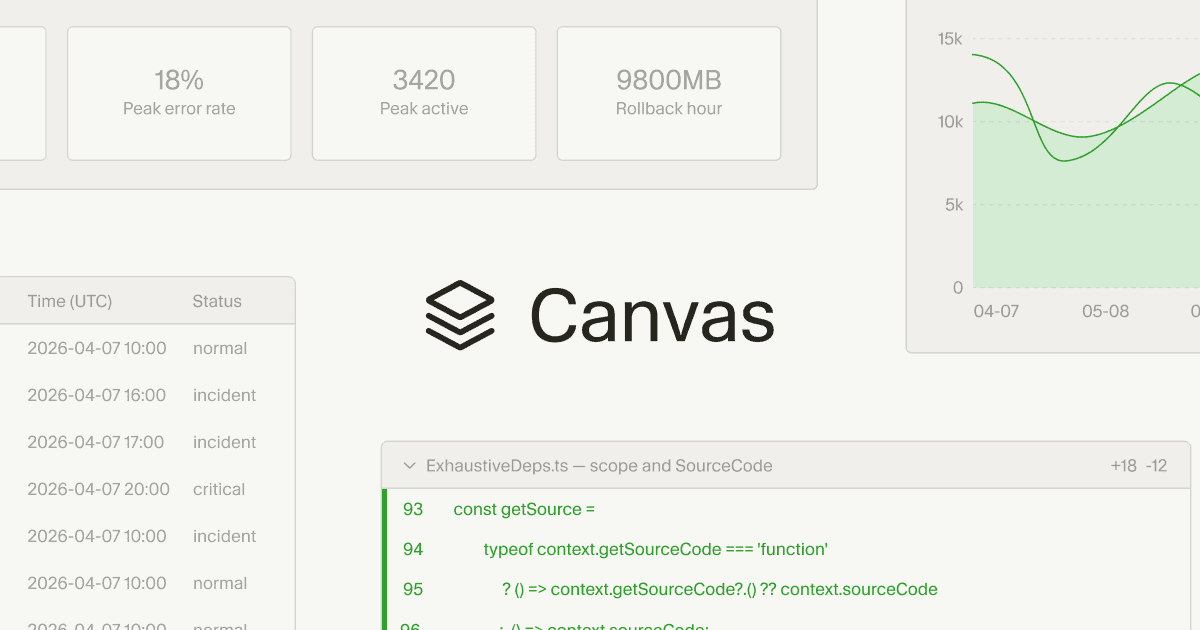
Cursor utilizes a React-based UI library to build these canvases, offering first-party components such as tables, boxes, diagrams, and charts. Agents also have access to existing Cursor elements like diffs and to-do lists, following established data visualization best practices. Users can teach agents to create specific types of canvases through custom skills; for instance, the Docs Canvas skill can generate an interactive architecture diagram of a repository.One key application is in incident response dashboards. Previously, AI agents might represent time-series data in a basic markdown table, which was challenging to interpret and required further steps for visualization. Now, an agent can create a dynamic canvas that joins data from Datadog, Databricks, Sentry, and even local debug files into a single, interactive chart.
This allows agents to uncover insights that might otherwise be overlooked. Canvases also streamline PR review interfaces. As code changes grow in complexity, traditional tools often present all modifications equally, forcing reviewers to manually identify critical sections.
With canvases, Cursor can logically group changes, prioritize essential parts for review, and present a rich interface for exploring the change set. The system can even generate pseudocode representations for complex algorithms, simplifying the review process.
Unlocking Deeper AI Analysis Capabilities
The internal team at Cursor uses canvases for tasks like eval analysis. This involves investigating evaluation results when modifying harnesses or releasing new models. Engineers previously had to inspect request IDs one by one to find patterns. By creating a skill, agents can now read all rollouts in an eval, group failures, and build a canvas to investigate failure modes. This approach recently helped Cursor release two new models with significantly less effort, by identifying previously hidden harness bugs.Canvases are also proving valuable in autoresearch experiments. In these scenarios, agents tackle complex optimization challenges related to client performance. The interactive visualizations allow users to monitor the agent's research progress in real-time, observing experiments and the hypotheses the agent is testing.
This provides greater transparency and control over automated research processes. This move to interactive visualizations aligns with a broader industry trend toward more capable and intuitive AI agents.
While Google Gemini now generates interactive visuals directly in chat for users to explore topics like moon orbits, Cursor's canvases focus on providing developers with dynamic interfaces for complex, real-world data. It's about increasing "information bandwidth," removing friction in human-agent collaboration, and expressing intent beyond simple text commands.
Developers can try the new feature in Cursor 3.1.